Humidity and Temperature Monitoring System
Overview
A quick and easy system to monitor the humidity and temperature of your environment. The Bolt team updated the BoltIoT-Arduino-Helper library with an example on interfacing DHT sensors with Bolt Cloud. This project demonstrates that integration, showing you how to collect and graph temperature and humidity data in real time.
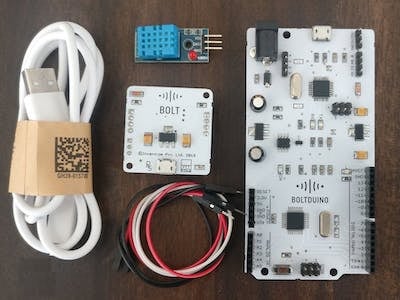
Hardware Components
| Component | Quantity |
|---|---|
| DHT11 Temperature & Humidity Sensor (4 pins) | 1 |
| Bolt WiFi Module | 1 |
| Arduino UNO & Genuino UNO | 1 |
Software Requirements
- Bolt Cloud
- Arduino IDE
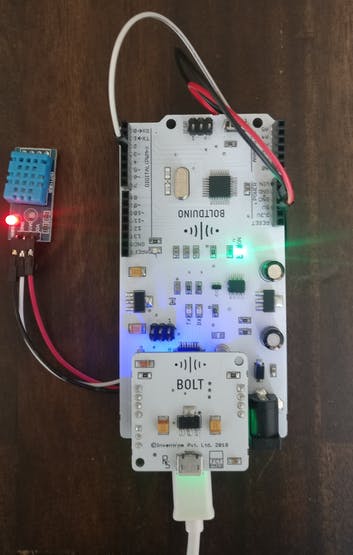
Hardware Setup
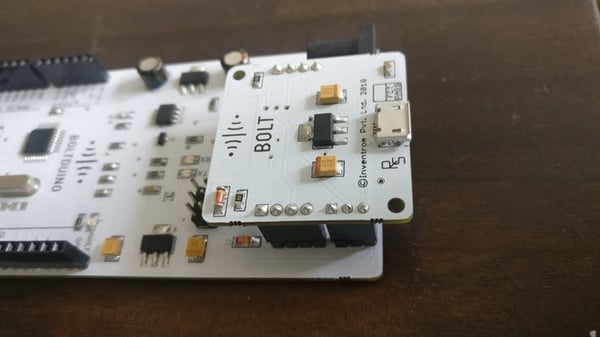
Step 1: Connect Bolt to Arduino/Boltduino
Connect the Bolt module using either direct pins (for Boltduino) or four male-to-male Berg pin wires (for Arduino UNO).
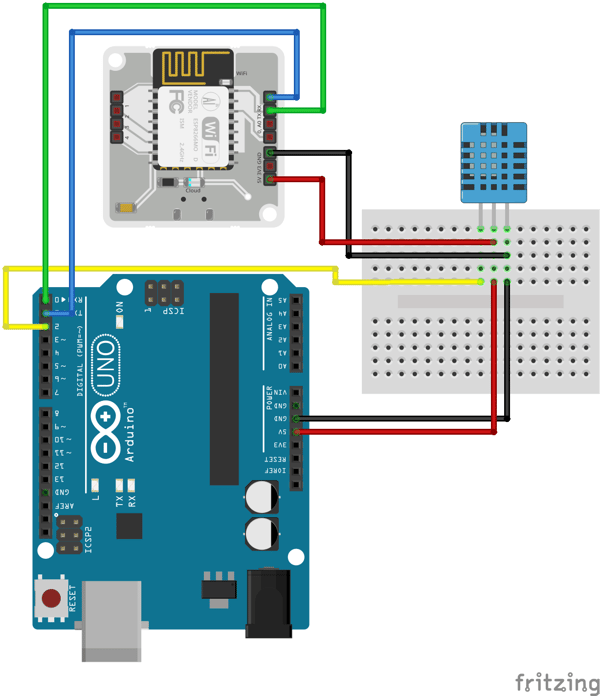
Step 2: Connect DHT11 Sensor
Connect the DHT11 temperature and humidity sensor to the Boltduino/Arduino following the schematic diagram below.
Software Programming
Step 1: Install Required Libraries
Three libraries are required:
Download the ZIP files from GitHub, then in the Arduino IDE navigate to Sketch > Include Library > Add .ZIP Library... and select each downloaded file.
Step 2: Upload Code to Arduino
Go to File > Examples > BoltIoT-Arduino-Helper > DHT2Cloud. Connect the Boltduino/Arduino to your PC and click Upload.
CAUTION: For Arduino Uno users, remember to disconnect the Bolt module from the Arduino while uploading the code.
Step 3: Create New Product on Bolt Cloud
Create an account on Bolt Cloud and link your Bolt WiFi module. Make sure to select Input Devices and UART options when creating the product.
Step 4: Configure Product
Name the code file with a .js file extension and enter the following visualization code:
var lineGraph1 = new boltGraph();
lineGraph1.setChartType("lineGraph");
lineGraph1.setAxisName('X-Axis Name','Temperature->');
lineGraph1.plotChart('time_stamp','Temperature');
var lineGraph2 = new boltGraph();
lineGraph2.setChartType("lineGraph");
lineGraph2.setAxisName('X-Axis Name','Humidity->');
lineGraph2.plotChart('time_stamp','Humidity');
Step 5: Link Device and Deploy
Link your Bolt device to the new product and click "Deploy Configurations."
Step 6: View Device
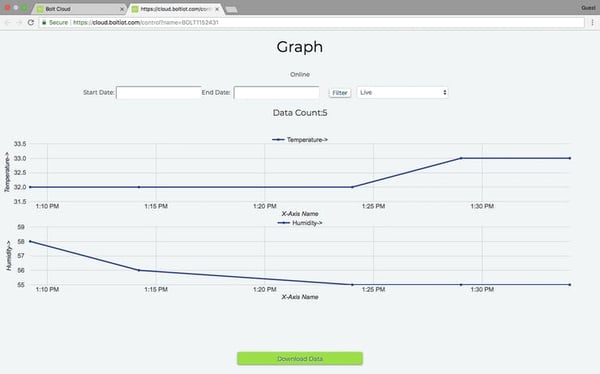
The Cloud polls the device for data every 5 minutes, so it would be best to leave the system running for about 20 to 25 minutes before you check the results.
Conclusion
After completing all steps, the system measures room temperature and humidity every 5 minutes through the Bolt Cloud platform. The data is displayed as line graphs, allowing you to monitor environmental conditions over time. This project serves as a foundation for more advanced monitoring systems.