


Ever wondered how you can predict the Temperature and Humidity of an industrial production environment?
How this project works?
In this project we will be monitoring the temperature of an industrial production line and predicting the future temperature values, all using the Bolt Cloud platform.
Though this project only talks about predicting temperature values, the configuration can be easily changed to predict the Humidity also.
Things used in this project
Hardware components -

- LM35 temperature sensor
- Connecting wires
Software components -
You can get the Bolt WiFi module and other items with the  . The kit is also included as part of the 'Bolt IoT and ML hands-on training'.
Hardware connections
Connect the LM35 sensor to the Bolt WiFi module as given in the diagram below.
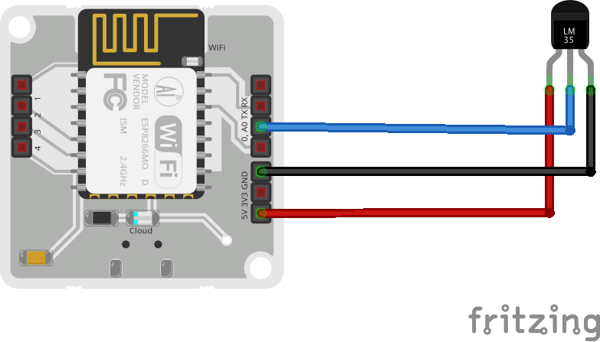 Since the LM35 sensor outputs analog temperature values, we will be connecting it to the A0 Analog pin of the Bolt.
Build the project
Set up the Bolt WiFi module if you have not done it already. Once the setup is done, the Bolt module will show as online on your account on cloud.boltiot.com.
Connect the components
Once you have connected the LM35 sensor to the Bolt WiFi module, connect the Micro-USB cable to the Bolt and power it.
The Blue and Green LEDs will blink a few times and glow continuously indicating that the device is sending the data to the Bolt Cloud.
Build a product to visualize the data
Step 1 - Log in to  .
.
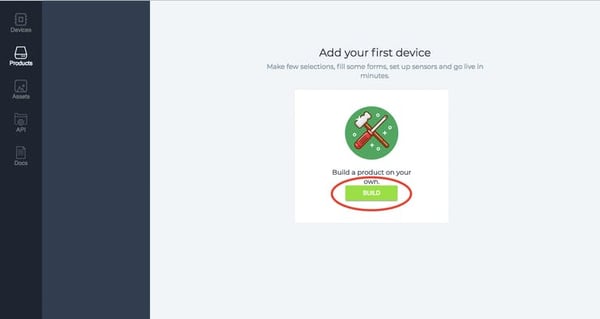
Step 2 - Create a new product.
Step 3 - Configure the product
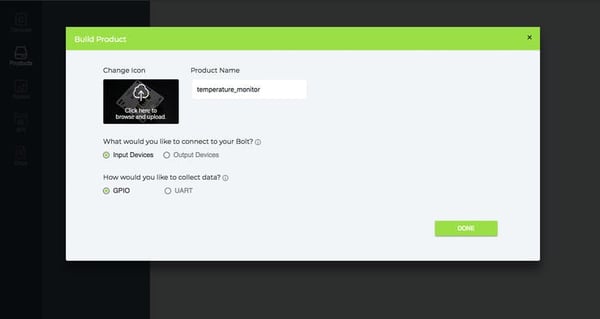
Choose a name for your product and choose Input device and GPIO as options when creating the product.
The product will be created once you click on Done.
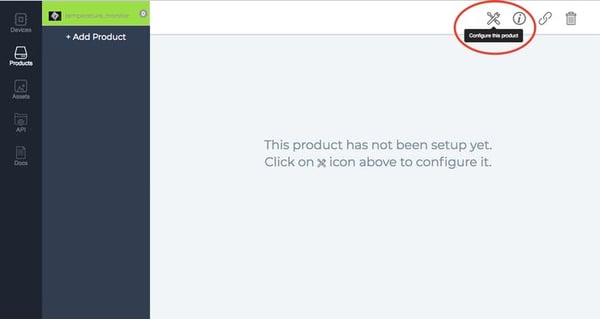
Step 4 - Hardware configuration of product
Once the product is created, click on "spanner" icon to enter the hardware config section of your product.
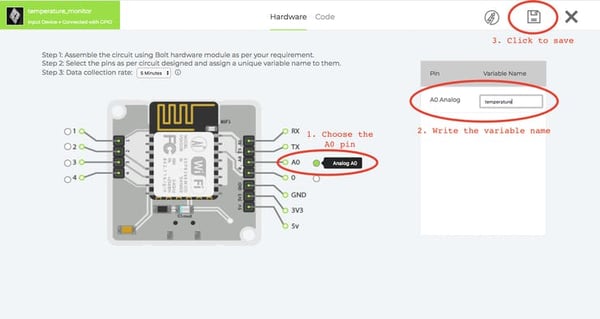 Choose the A0 pin and give a suitable name like temperature to it.
Finally click on "Save" icon to save the config.
Step 5 - Software configuration
Now that the hardware configuration is done, we will need to write the code for visualizing the temperature data received from the Bolt device and to predict the future values.
Click on the Code section and write the code as below.
setChartLibrary('google-chart');
setChartTitle('Temperature Monitor');
setChartType('lineGraph');
setCrosshair(true);
mul(0.0977);
setAxisName('time_stamp','temperature');
plotChart('time_stamp','temp');
Choose a name for the code and choose the extension as .js
Save the code by clicking on the "save" icon.
The working principle of the system is quite easy. Let understand it.
Here in our system, LM35 is the sensor that senses the temperature of its environment and based on it's value it generates an analog output voltage. This analog voltage produced by the LM35 is then given as input to the Bolt A0 pin. The Bolt then converts the analog value into a 10 bit digital value that varies from 0-1023. This digital data is sent to the cloud via Bolt device.
Hence, while plotting the temperature, it is required to convert the raw sensor values into the actual temperature value, which is done using the given formula:
temp = (analog_value*100)/1023
The converted digital data is then plotted for visual representation.
Step 6 - Link device to the product
Now that the product is ready with the code, we will need to attach a Bolt device to the product so that it can start gathering data.
Step 7 - View data
Click on View data button to view the data that has been gathered till now. If you have recently made the product, you will only see a few points on the graph.
To get accurate predictions, you will need to gather additional points. So wait for a few minutes until at least 20 points have been gathered by the system.
Once you have a few data points, this is what the graph will look like.
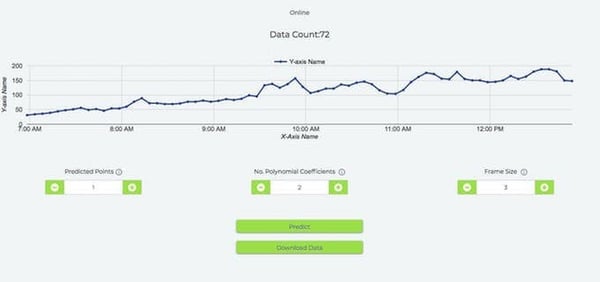
The visualiser add a ‘predict now’ button into the view, along with a few editable data fields. The editable fields are explained below
- Prediction points: This number tells the Visualiser how many future data points need to be predicted. By default, the Visualiser spaces the points with the data collection time in the hardware configuration of the product. So if you set the product to collect data every 5 minutes, and select 6 prediction points, the Visualiser will predict the trend and show 6 points up to 30 minutes into the future.
- No. Polynomial coefficients: Polynomial Visualiser processes the given input time-dependent data, and outputs the coefficients of the function of the form shown below, which most closely resembles the trend in the input data. This number tells the Visualiser how many elements should be present in the function i.e. the value of n.

- Frame Size: These are the number of previous data points the Visualiser will use to predict the trend of the data. For example, if you set this value to 5, the Visualiser will use the previous 5 points to predict the trend.
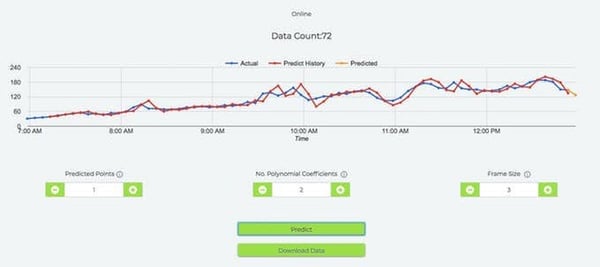
When you click the 'Predict' button, the prediction history (Red line) and the next predicted trend (Yellow line) are added to the graph.The prediction history is a graph of points the Visualiser would have predicted, at the time with the data before that point in time, using the current settings.
Conclusion
Using this handy prediction tool by the Bolt Cloud, you will be able to predict future values. This can be useful in an industrial environment like a Pharmaceutical industry where environment monitoring is essential to the quality of the product.
Want to build more such IoT and ML projects? Want to learn IoT and ML from basics?
Check out the Bolt IoT and ML training. This online video training is excellent for those who want to start with IoT and ML because it teaches you to build projects from the basics. Click on the button below to know more about the training.